Code
using Plots

year = 1955:5:2000
temp = [ -0.0480, -0.0180, -0.0360, -0.0120, -0.0040, 0.1180, 0.2100, 0.3320, 0.3340, 0.4560 ]

scatter(year, temp, label="data", xlabel="year", ylabel="anomaly (degrees C)", leg=:bottomright)Previously, we saw how interpolating data with a polynomial can be solved by a linear system of equations. However, interpolation is often not an appropriate model for learning a functional relationship from data!
using Plots
year = 1955:5:2000
temp = [ -0.0480, -0.0180, -0.0360, -0.0120, -0.0040, 0.1180, 0.2100, 0.3320, 0.3340, 0.4560 ]
scatter(year, temp, label="data", xlabel="year", ylabel="anomaly (degrees C)", leg=:bottomright)t = @. (year-1950)/10
n = length(t)
V = [ t[i]^j for i in 1:n, j in 0:n-1 ]
c = V\temp10-element Vector{Float64}:
-14.114000001832462
76.36173810552113
-165.45597224550528
191.96056669514388
-133.27347224319684
58.015577787494486
-15.962888891734785
2.6948063497166928
-0.2546666667177082
0.010311111113288083using Polynomials
p = Polynomial(c)
f = yr -> p((yr-1950)/10)
plot!(f,1955,2000,label="interpolant")For this application, this functional relationship is far too complex! This is known as overfitting.
We can get better results (in this case and many others) by relaxing the interpolant requirement – this is equivalent to lowering the degree of the fitting polynomial.
Let \((t_i, y_i)\) for \(i = 1, \cdots, m\) be the given points, and let the polynomial be given by \[y \approx f(t) = c_1 + c_2 t + \cdots + c_{n-1} t^{n-2} + c_n t^{n-1},\] with \(n < m\).
We seek an approximation such that \[\begin{bmatrix} y_1 \\ y_2 \\ y_3 \\ \vdots \\ y_m \end{bmatrix} \approx \begin{bmatrix} f(t_1) \\ f(t_2) \\ f(t_3) \\ \vdots \\ f(t_m) \end{bmatrix} = \begin{bmatrix} 1 & t_1 & \cdots & t_1^{n-1} \\ 1 & t_2 & \cdots & t_2^{n-1} \\ 1 & t_3 & \cdots & t_3^{n-1} \\ \vdots & \vdots & \cdots & \vdots \\ 1 & t_m & \cdots & t_m^{n-1} \end{bmatrix} \begin{bmatrix} c_1 \\ c_2 \\ \vdots \\ c_n \end{bmatrix} = \mathbf{V}\mathbf{c}.\]
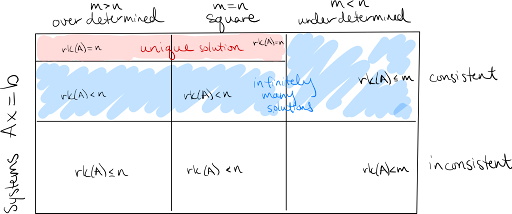
Note that this matrix has the same structure as the Vandermonde matrix but is \(m \times n\) with \(m \ge n\), and the system is overdetermined – it has more conditions than variables.
Overdetermined systems are often inconsistent, like this one, and have no exact solution (although it is not impossible for such a system to be consistent). The best approximation of such a system is also given by the \ operator in Julia.
V = [ t.^0 t ]   # Vandermonde-ish matrix
@show size(V)
c = V\temp
p = Polynomial(c)
size(V) = (10, 2)f = yr -> p((yr-1955)/10)
scatter(year,temp,label="data",xlabel="year",ylabel="anomaly (degrees C)",leg=:bottomright)
plot!(f,1955,2000,label="linear fit")A cubic polynomial fits the data even better.
V = [ t[i]^j for i in 1:length(t), j in 0:3 ]
@show size(V)
p = Polynomial( V\temp )
plot!(f,1955,2000,label="cubic fit")
size(V) = (10, 4)This problem here is to fit \(y_i \approx f(t_i)\) where \(f(t) = c_1 + c_2 t^1 + \cdots + c_n t^{n-1}\). This is a special case of the more general case with generic basis functions \(f(t) = c_1 f_1(t) + c_2 f_2(t) + \cdots + c_n f_n(t)\).
In either case, the fitting problem solved here is \[\min R(c_1, \cdots, c_n) = \sum_{i=1}^m [y_i - f(t_i)]^2 =: \mathbf{r}^\top \mathbf{r} = \|\mathbf{r}\|^2,\]
where \[\mathbf{r} = \begin{bmatrix} y_1 \\ y_2 \\ \vdots \\ y_{m-1} \\ y_m \end{bmatrix} - \begin{bmatrix} f_1(t_1) & f_2(t_1) & \cdots & f_n(t_1) \\ f_1(t_2) & f_2(t_2) & \cdots & f_n(t_2) \\ \vdots & \vdots & \cdots & \vdots \\ f_1(t_{m-1}) & f_2(t_{m-1}) & \cdots & f_n(t_{m-1}) \\ f_1(t_m) & f_2(t_m) & \cdots & f_n(t_m) \end{bmatrix} \begin{bmatrix} c_1 \\ c_2 \\ \vdots \\ c_n \end{bmatrix}.\]
Here, \(\text{argmin}\) is short for argument minimizing – this asks one to find the variable, \(\mathbf{x} \in \mathbb{R}^n\), that minimizes the objective funcion.
Note that if we find a solution to the linear system, then \(\mathbf{r} = \mathbf{0}\).

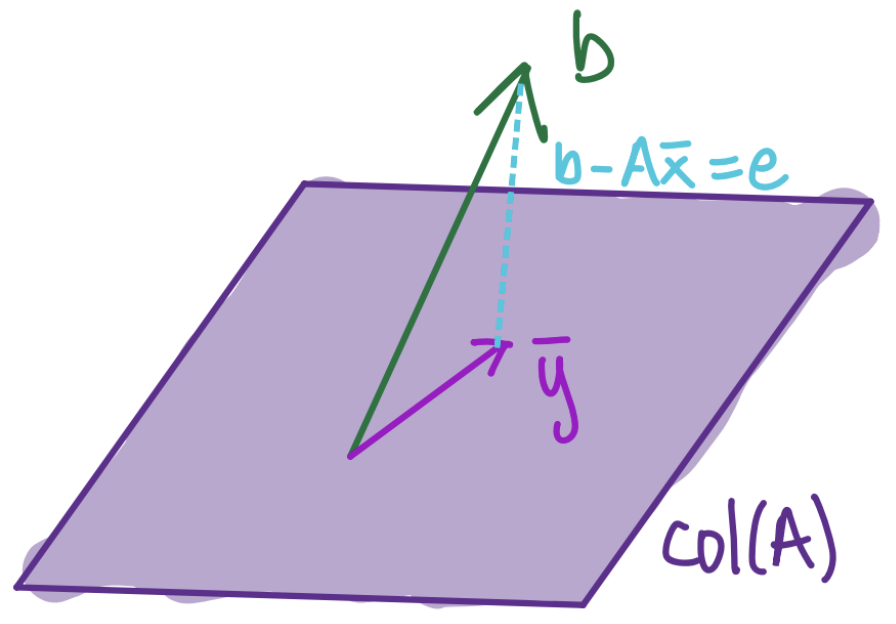
The normal equations show us that we can solve the least-squares problem by solving this system of linear equations.
The overdetermined least-squares problem has solution \(\mathbf{x} = \mathbf{A}^\dagger \mathbf{b}\). In Julia, the backslash operator \ is mathematically equivalent to left multiplication by the inverse matrix in the square case and by the pseudoinverse in the overdetermined rectangular case.
The algorithm for solving least-squares by the normal equations is:
"""
    lsnormal(A,b)
Solve a linear least-squares problem by the normal equations.
"""
function lsnormal(A,b)
    N = A'*A; z = A'*b;
    R = cholesky(N).U
    w = forwardsub(R',z)
    x = backsub(R,w)
    return x
endlsnormalJulia does not solve the linear least-squares problem through the normal equations in the algorithm used by \. Using the normal equations is unstable.
The normal equations are a square system, so we know from the square case that perturbations to the data \(\mathbf{A}\) and \(\mathbf{b}\) can be amplified by a factor of \(\kappa(\mathbf{A}^\top \mathbf{A})\).
We’ll be able to prove this when we see some techniques later in the semester. The takeaway is that solving the normal equations doubles the instability of solving the least-squares problem – we shouldn’t do this!
using LinearAlgebra

t = range(0,3,length=400)
f = [ x->sin(x)^2, x->cos((1+1e-7)*x)^2, x->1. ]
A = [ f(t) for t in t, f in f ]
κ = cond(A)1.8253225426741675e7x = [1., 2, 1]
b = A*x;x_BS = A\b
@show observed_error = norm(x_BS - x)/norm(x);
@show error_bound = κ*eps();observed_error = norm(x_BS - x) / norm(x) = 1.0163949045357309e-10
error_bound = κ * eps() = 4.053030228488391e-9Given the condition number of this matrix, we expect that solving the linear system, we will lost at most 7 digits of accuracy – this agrees with what we see!
However, if we solve the normal equations, we have a much larger condition number and may not be left with more than two accurate digits.
N = A'*A
x_NE = N\(A'*b)
@show observed_err = norm(x_NE - x)/norm(x);
@show acc_digits = -log10(observed_err);
observed_err = norm(x_NE - x) / norm(x) = 0.021745909192780664
acc_digits = -(log10(observed_err)) = 1.6626224298403076